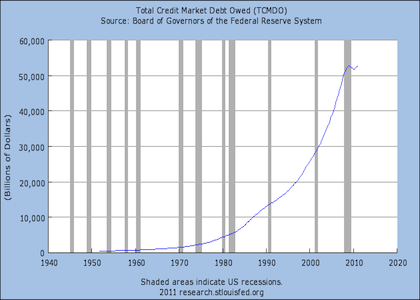
The chart below is “Total Credit Market Debt Owed,” direct from the Federal Reserve’s graphical web interface “Fred Graph.” Anyone can see that the graph had gone parabolic right before the onset of the Great Recession. Anyone can see that this rate of ever-faster accumulation of debt couldn’t continue. And, it didn’t continue, it stopped. Because it had to.
Yes, Virginia, the graph actually shows that there is $50,000 Billion, or $50 Trillion, of total debt owed in the United States. In spite of the Fed’s best efforts to keep this bubble growing, IT HAD TO STOP. If you want to know why so many in the Austrian School predicted a collapse, this graph could be one very simple indicator of why. Not only is the rate of federal debt accumulation unsustainable, but the overall rate of debt accumulation in the general economy is unsustainable. No one could predict exactly when, but this debt bubble had to explode.
By the way, GDP of planet earth is…$50 Trillion per year. Now, who will make the case that all we need to do is just go deeper in debt and all of our problems will be solved?


